
What did you create?
LeanTossup has created a model to map UK election results down to local small areas (census tracts or “precincts”) and tallied that data up to larger local areas (wards) to determine which party won each ward in each national election since 2010 to 2019 UK Election, including the 2016 European Union Referendum.
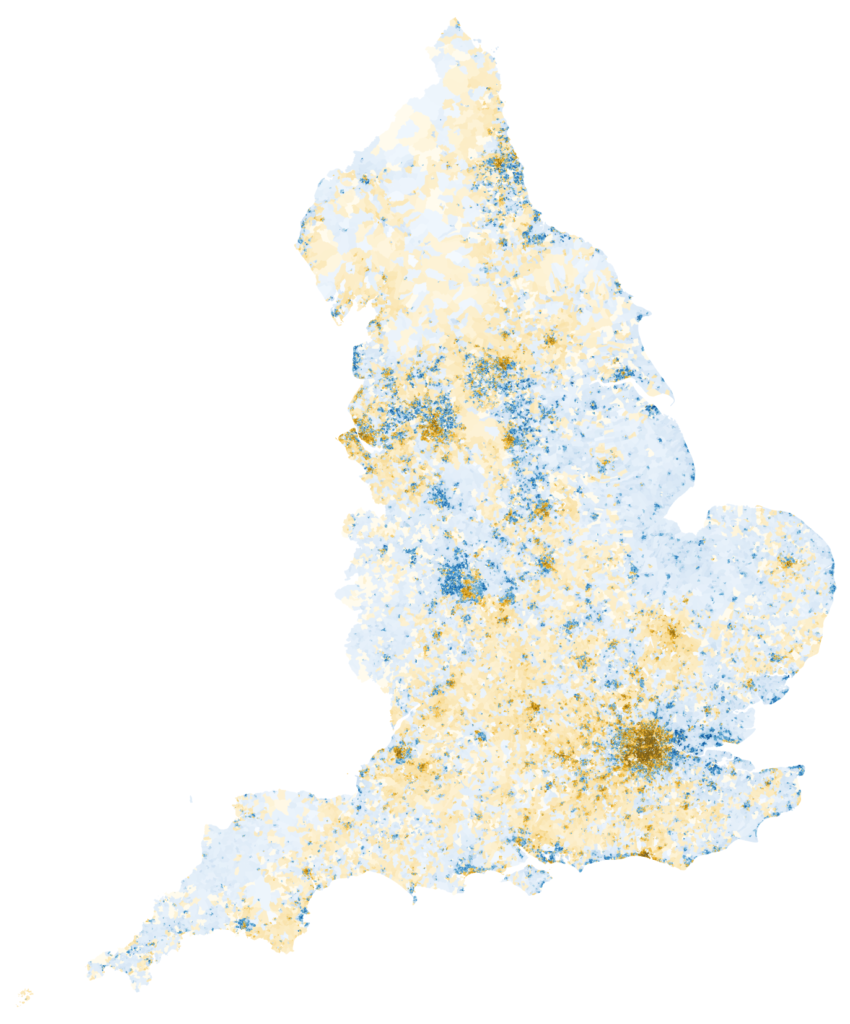
UK Census Tract Model, European Union Referendum, England only. Leave is coloured in blue, Remain in yellow. Although there are a large number of Remain coloured Tracts on the map, larger Census Tracts are shown in darker colours. This highlights that low population well off exurban Tracts voted Remain, but were outvoted by more urban voters.
Why did you do this?
In most countries, election data is collated at small levels of population – by polling stations, by local areas, by municipalities, by county, etc. – except in the United Kingdom. There is no widespread data collection of this kind for UK general elections nor for European Parliament elections and the two recent national referendums. The only datasets widely available are on the constituency or Authority/Regional level, large areas that represent slightly less than 100,000 people (parliamentary constituencies) or hundreds of thousands and in some cases millions at the Local Authority level (e.g., 1.14 million in Birmingham). Although these results still tell us much of the voting patterns of its constituents, it does little to tell us about community-level trends as we would be able to in places like the United States or Canada.
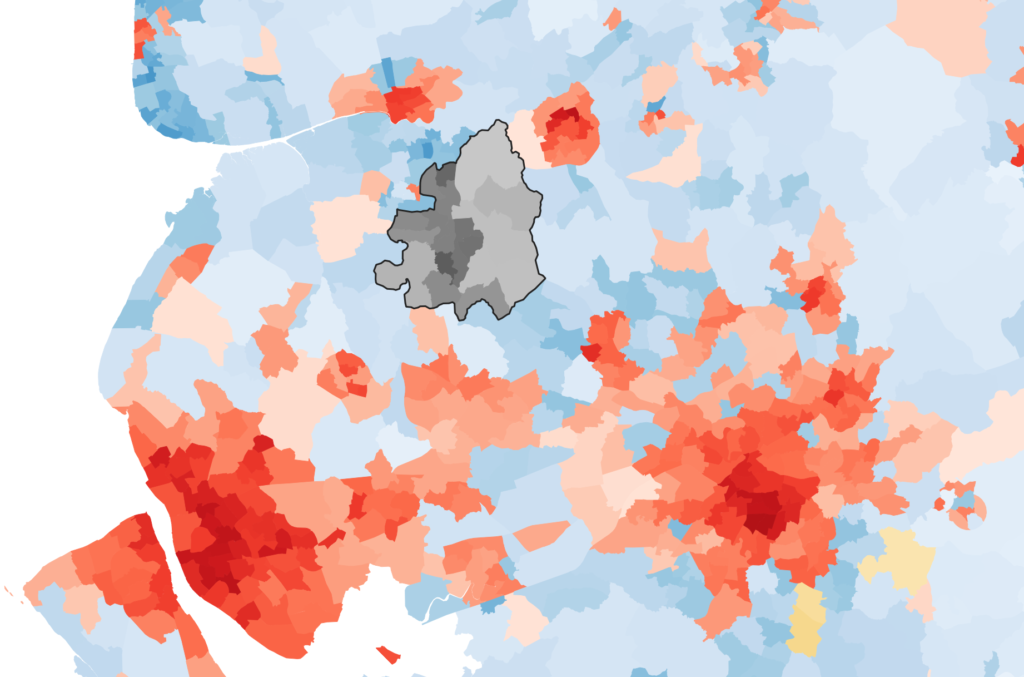
UK 2019 General Election, Wards results in the Liverpool/Manchester area. Wards are coloured by vote margins in each ward
How did you create these ‘precincts’?
This was the first problem we had to solve for this project. While looking for a geographic boundary to use, we discovered that the UK census reports many demographics that are useful for election modeling in small local areas called Census Tracts. There are over 232,000 census tracts in the UK, which make them small enough that each constituency or medium-sized Local Authoritywill have several hundred Census tracts in it. By matching those census tracts to a ward/constituency/local authority, election results can be projected down through demographic trends, and then tallied up to match to the known result in these districts.
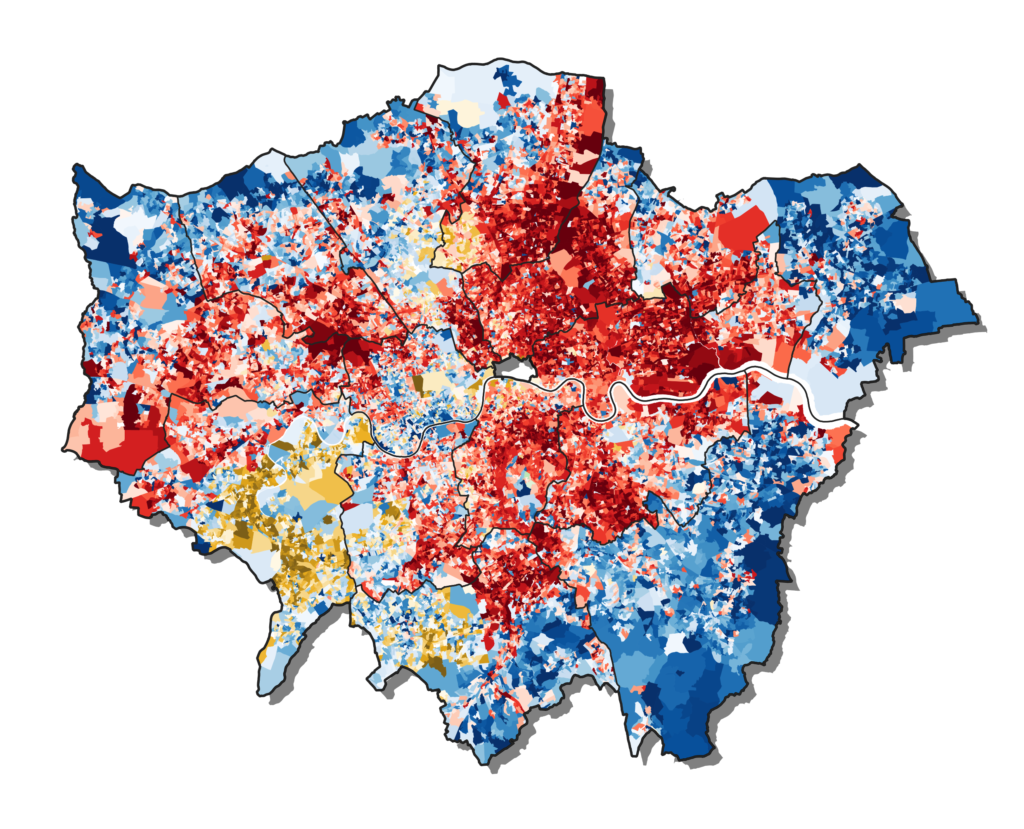
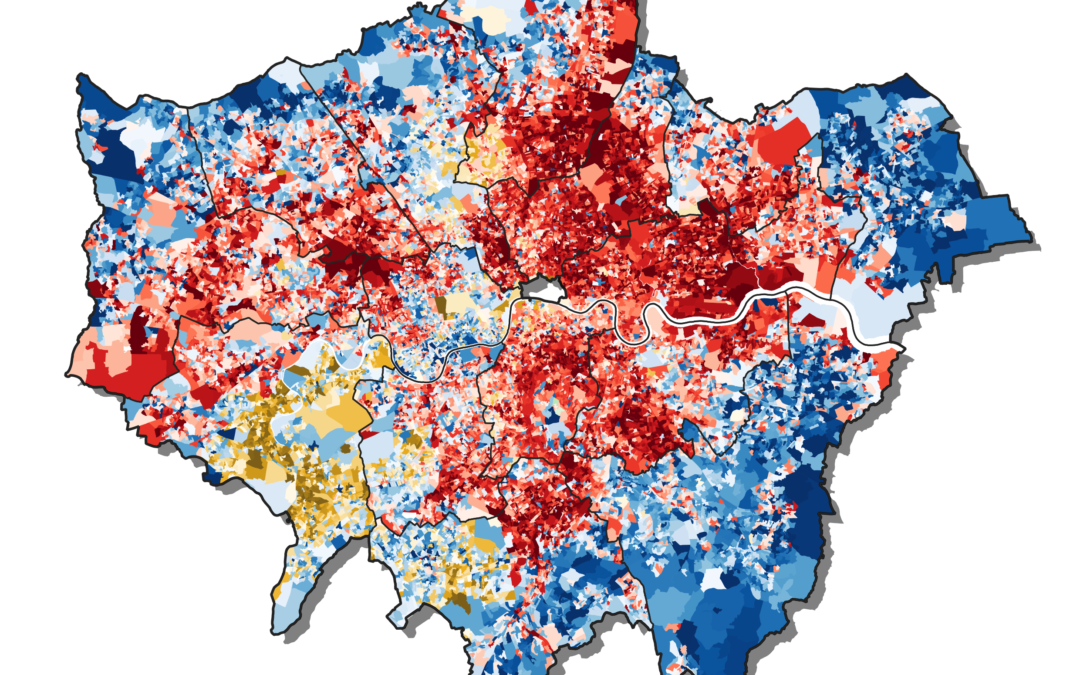
London, UK General Election 2019
How do you make projections for each precinct?
To determine results for each precinct, they are matched to the constituency boundaries for general elections, or the local authority boundaries for the 2016 Referendum. The next step involves gathering demographic information for each district and the same demographic information for the relevant census tracts in the UK. The demographics we used were age, race, and educational data. Income is not available at the census tract level.
The next step is to create a multi-leveled regression for each region: Scotland, Northern Ireland, Wales, North East, North West, Yorkshire and Humber, West Midlands, East Midlands, South East, East, South West, and London. Regressions are made relating vote shares for each party in each voting district to the different demographics studied. In this way, the program will have multiple regressions. For example, for the Conservative party in the North East, this regression relates their vote share in each parliamentary constituency to the demographics of those same constituencies. The program then finds the demographic regressions that are most correlated for each party, and then weighs all of them accordingly, which allows for the most predictive demographics for each party to be the highest weighted in each region.
Birmingham, 2017 General Election
Birmingham, 2019 General Election
If, for example, the Liberal Democrats vote share was highly correlated with higher education in the South East, but Conservative vote share in the South East was highly correlated with age, then the model allows each of those factors to correlate strongly to their vote share – without impacting the other regional projections.
All of the census tracts or ‘precincts’ for a region are then projected using these regressions. The final step is to use the percentage of population of a district each precinct represents, and calculate the predicted raw vote totals per precinct. Then all of the precincts in each district are tallied and compared to the final results. The precinct results are adjusted (using a multiplicative factor) to the final results in each district.
After the precinct results are complete and verified to be as accurate as possible, we are able to calculate other results, such as wards, authorities, and so on, using the precincts as a base.
Other UK websites have projected ward results for past general elections. Why are yours different?
Other websites use local election data, such as local elections or devolved assembly elections, to try and pin relative party strength in each ward. They will then transpose those guesses to the General Election. However, we feel this ignores partisanship changes over time.
When partisanship changes, it can change very rapidly. There are very likely thousands of wards that voted for Boris Johnson’s Conservatives in 2019 that never voted Tory in generations, if ever before, and those larger shifts will not be apparent from local election data prior to 2019, or even the 2017 general election. While eventually local elections will catch up to the broader trend, it could be years before the full extent of the shift is revealed.
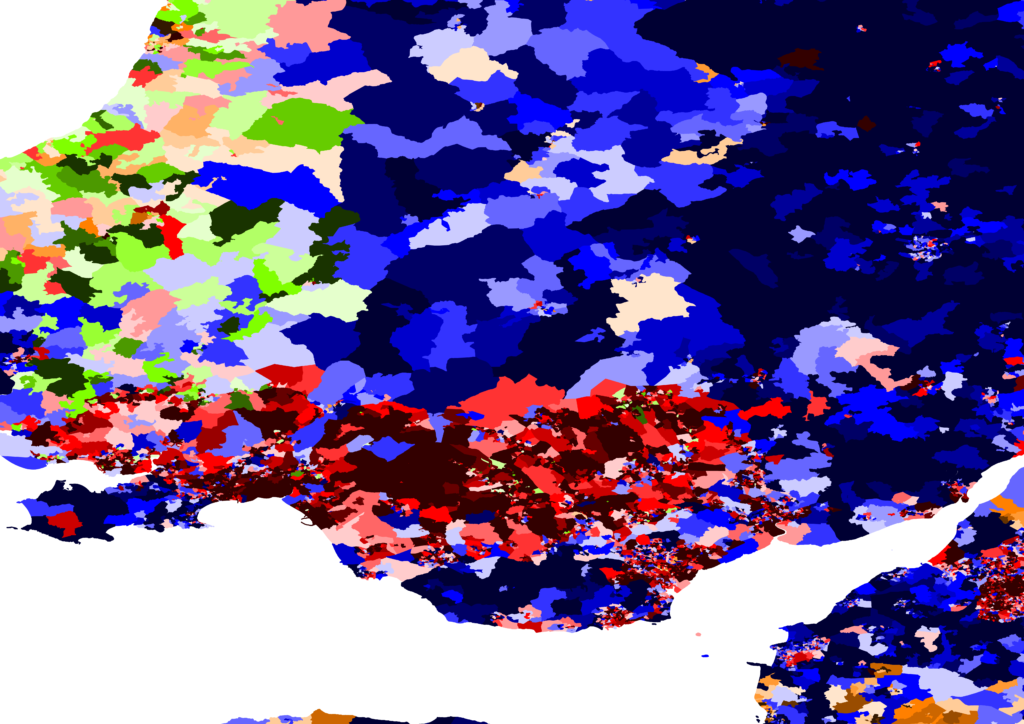
South Wales, 2017 General Eleciton
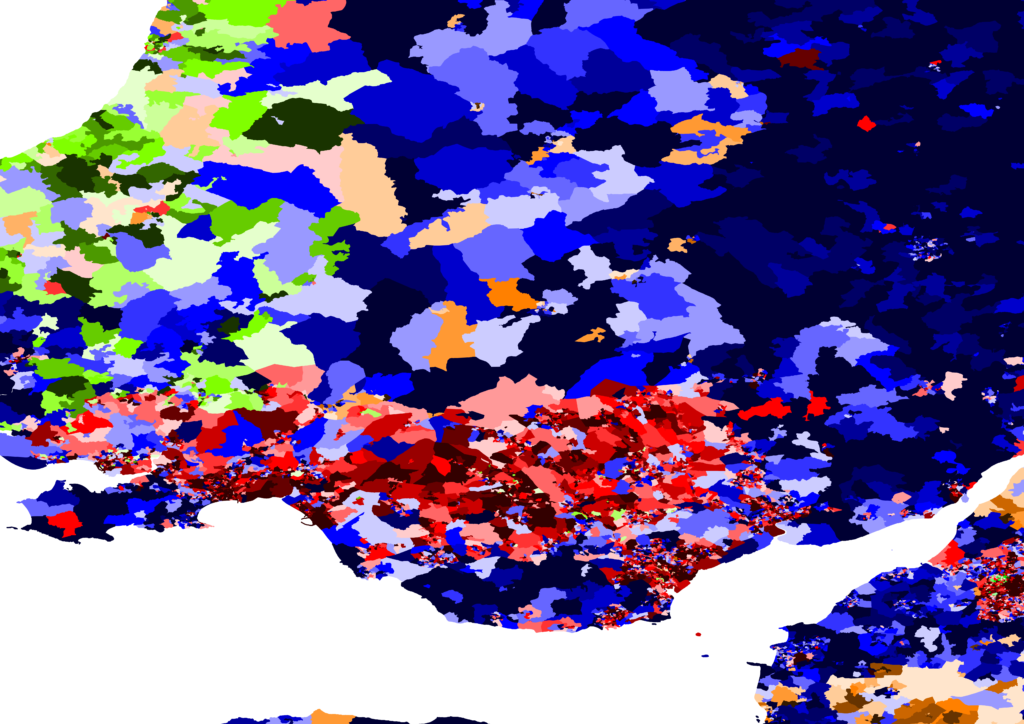
South Wales, 2019 General Election
The LeanTossup UK Precinct Model does not take into account local election data, and so does not rely on it. It is purely an extrapolation of national-level results down to the smallest manageable census unit, which we use as a base. This is similar to what is done in the United States, and allows for a broad range of datasets never before available to UK researchers and psephologists.
How do you know these results are accurate?
We at LeanTossup make no claims to perfection. There are a vast number of solutions to the problem we’re attempting to solve, and it’s not unlikely someone else out there has or will find one that is more accurate, or relies on less assumptions than our model does. We are fully aware that not every precinct, ward, authority or constituency will be exactly accurate.
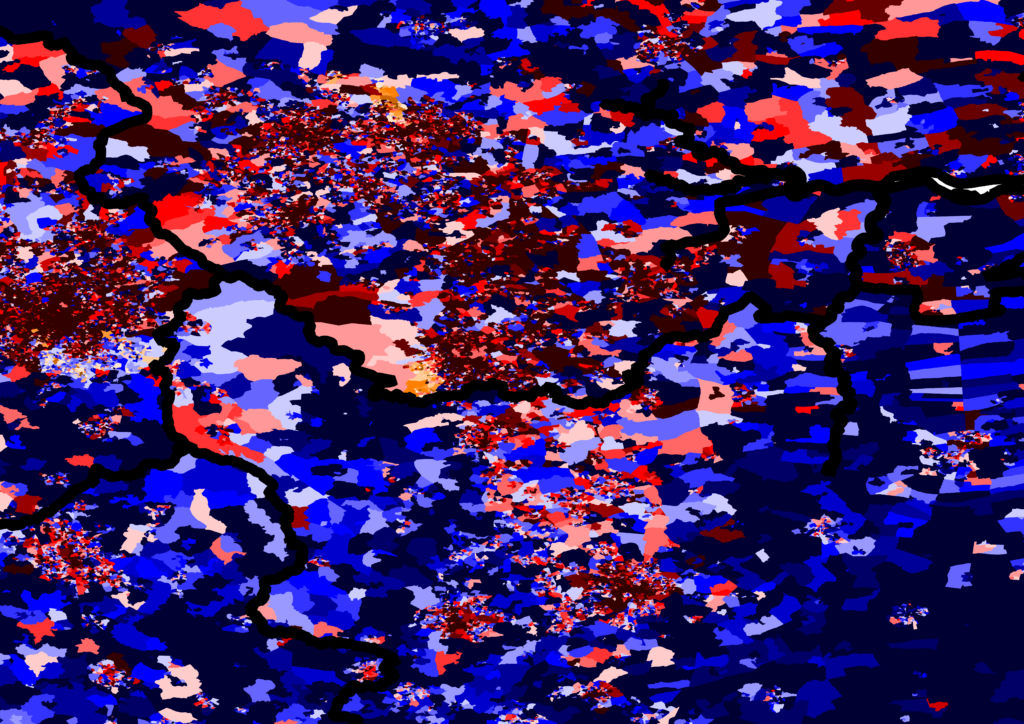
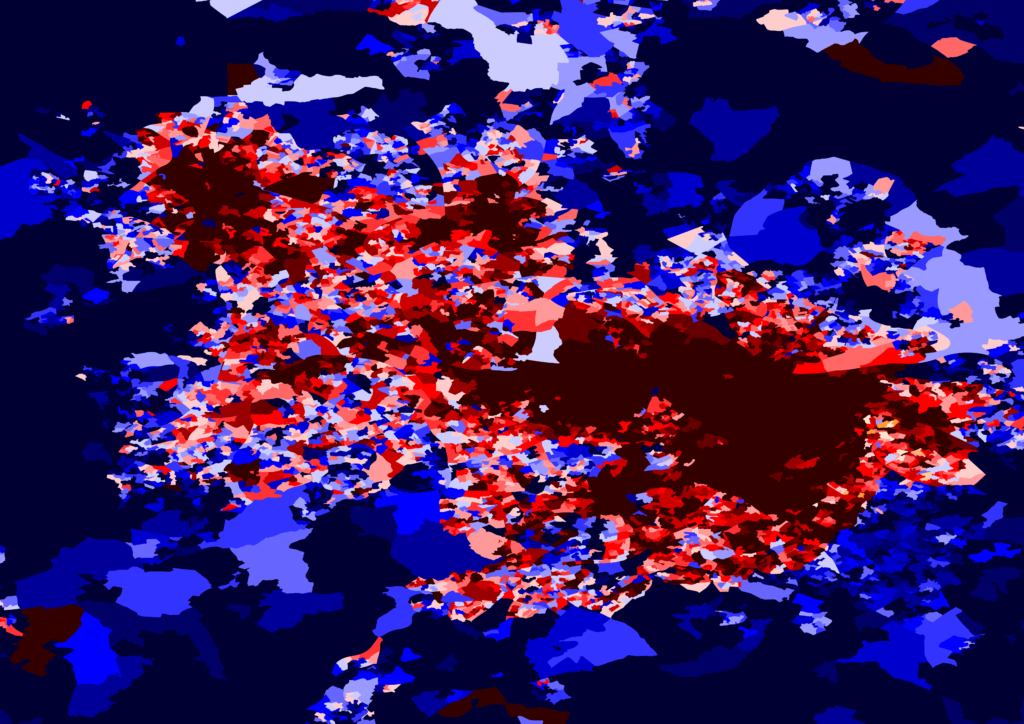
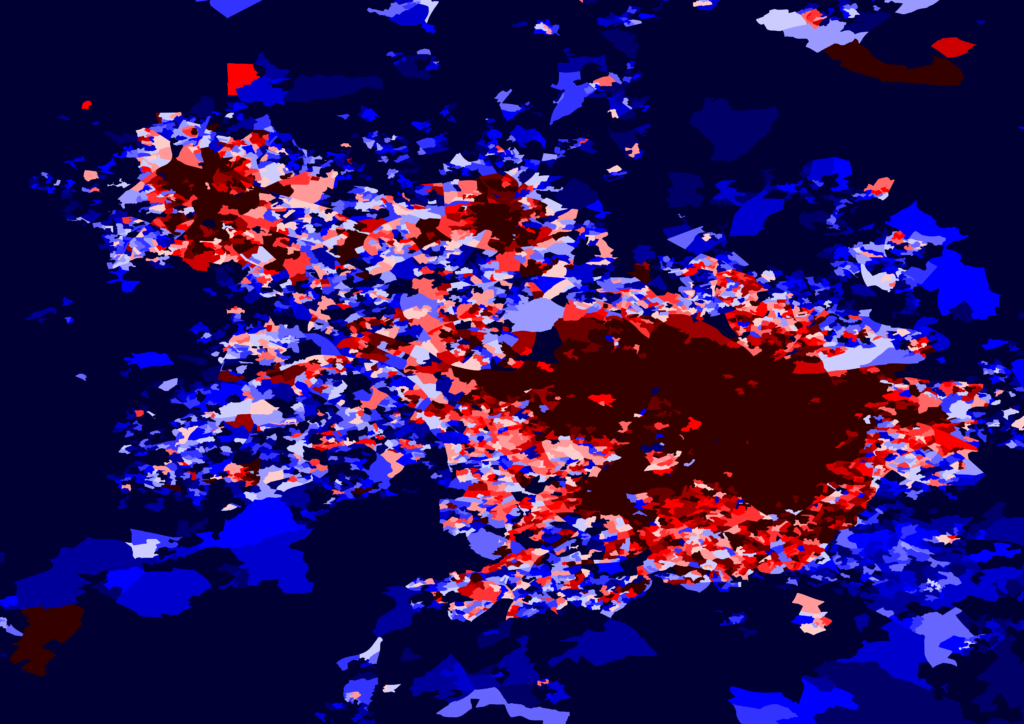
Yorkshire/Red Wall, 2017 General Election
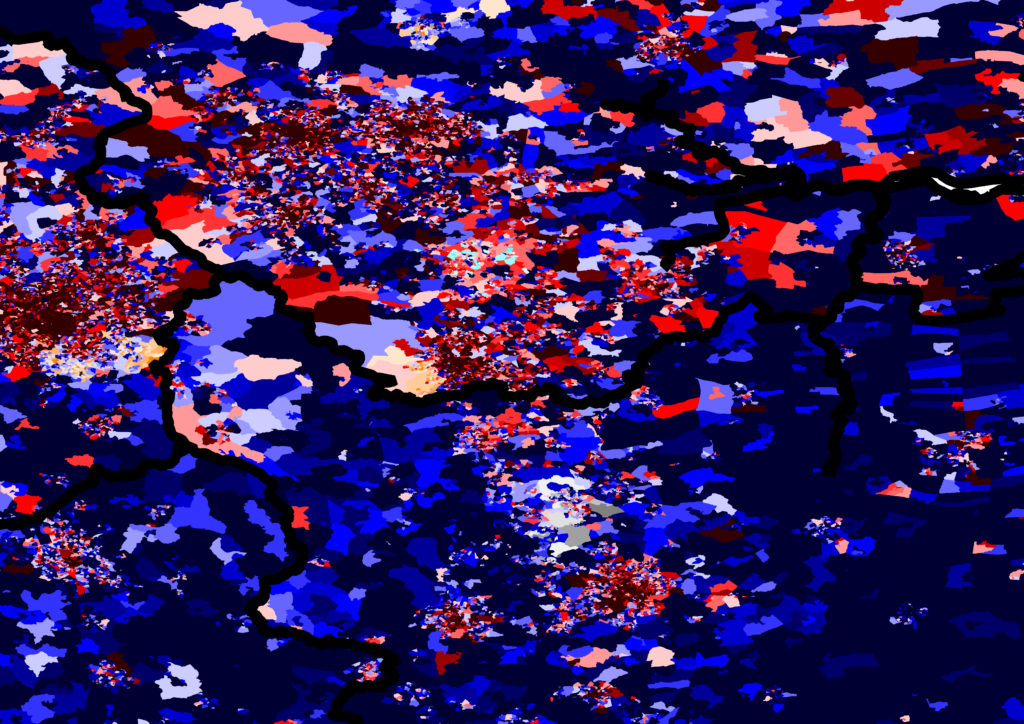
Yorkshire/Red Wall, 2019 General Election
However, we stand behind our model as a novel and far more accurate solution than so far publicly presented by other websites. We’ve extensively tested the model against past elections and other modelers, such as Chris Hanretty’s 2016 Referendum by Constituency results, and found them to be in close agreement. Of the constituencies with significant differences (50 within a 10-point difference from Hanretty’s final model), many of them were in agreement with Hanretty’s initial model before the later release of data by authorities. We’ve also found some predictive use from the model with recent local by-elections, though because of the pandemic our chance to test the model has been far more limited than we’ve hoped.
All this is to say that we are testing the model constantly, looking for ways to improve where we can, and discovering its limitations as well. Here at LeanTossup, we are always striving for the most accurate results, but always ask our readers to use our predictive data at discretion, and cautiously.
However, let our latest examples of the precinct map at work speak for itself. You can find the ward results here: