
As the dust has begun to settle on the 2020 election, most of the modelers have begun dissecting what went right and what went wrong. At LeanTossup we’re not pulling any punches here, we were wrong. We’re not going to point to calling 46/51 states correct, or calling the correct winner to try to claim a hollow victory. We were confident that Biden would win Florida, North Carolina, and even Texas. We were confident that Democrats would win the Senate, and gain House seats. Even though polling near the end of the campaign agreed with our theories about the race from earlier in the Spring/Summer, at the end of the day those were calls on our website, and we stand with them, even in their failures.
We were not bullish on Democrats for partisan purposes. We have been accused of favouring one side or the other in every election we have called, from Liberal hacks in Canada, to pro-Brexit Conservatives in the UK. We were also not deliberately trying to inflate Predictit markets. Even though (as Canadians) we cannot bet on Predictit, we were able to place bets on sportsbooks, and we have the receipts to show losses in Texas and other states, but also (hopefully at some point) wins in Georgia and the overall election winner, which would allow our readers (along with me) to get a profit from the bets we recommended to place. We were not lying in our analysis, we were right there with you, placing bets just the same as we recommended.
So the question becomes, what went wrong for the model? Was the problem polling? Model failure? Something more? Are there any bright spots you can point to in the model? This article will likely be the first in a series of articles, so for the first one, let’s go through what went wrong with the Presidential polling specifically (we’ll look at Congressional polling, and a more specific look at the demographic sub-groups in other articles) see what went wrong, and why.
The polling looked nothing like what we actually saw on election night
After the 2016 election, there was much analysis of what went wrong with the polling. While this website didn’t exist in 2016, I was definitely a heavy consumer of political and data science news, and followed the examination of what happened very closely. The lessons I learned from that time were that models were over confident for such a small Clinton lead (2-4 points nationally, roughly the same or less in key swing states) and that polls poorly weighted for education, leading to overly white college educated samples, which gave Clinton larger leads than she had in many swing state polls. Secondly, that Clinton’s deficit with non-college white voters was far more damaging than the polls had accounted for, because they had more undecided voters in that group, and due to the previously mentioned poor weighting schemes, represented a smaller share of the electorate than they would eventually cast votes for. We accounted for this, by creating a Likely Voter screen, to be able to compare to swing state (and National) polls to make sure that pollsters didn’t have overly white educated samples, or were not containing too many minority voters.
This Likely Voter screen was invaluable, and, from looking at some early exit polls (from Fox News, which are deeper and more accurate than the other ones) appears deadly accurate at determining the composition of the electorates in each state. We believed that simply having more accurate electorates would fix the pollsters problems from 2016, and not be systematically biased against Trump again. For this reason, when we saw pollsters with electorates that matched ours, it lowered our concern of a polling miss similar to 2016, and increased our confidence in the model. Additionally, in other countries, although sometimes there are polling misses, they are never consistently in the same direction, as pollsters usually correct their mistakes from the last time, and are just as likely to miss in the other direction from overcorrecting rather than the same direction again. This lead us to downplay concerns about systematic error favouring Democrats, as it was unlikely to repeat itself again after 2016, and there was very little evidence of it from the 2018 Midterms, of which Trump was very much involved.
However, as we now know, almost every poll was systematically biased towards Democrats, many by as much as 5-6 points, with some even larger misses than that. When the model sees a national environment of around 10 points, and extrapolates that backwards, you get Biden winning Texas, Florida, Georgia, Ohio and Iowa. This is why the model was so aggressive in those states, and represents the fundamental problem of election models: garbage in, garbage out. If the data is pointing to a ~10 point national lead, and then that doesn’t happen, then the model is obviously going to have many misses. As a Teaching Assistant (TA) at Brock University in Biology, each semester I find myself giving the same talk about accuracy and precision. When thinking of the polling miss in 2020, I can’t help but think about this image, that is always a part of my talk about systematic error:
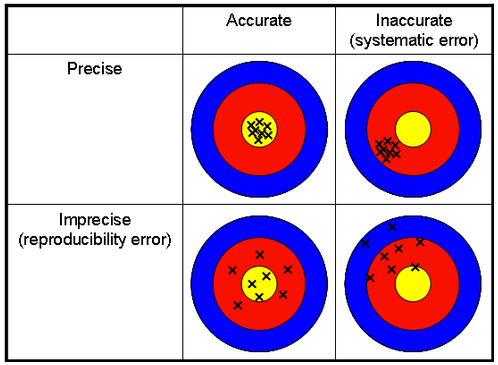
The reason I keep thinking about this image, is because there is no better visual representation of the polling miss than the top right quadrant: Precise but Inaccurate (Systematic error). Almost every public poll systematically overestimated Democratic support, almost to the same degree across all pollsters. Although many people claim that the 2016 polling was a similar miss to the 2020 polling, it is simply not true. The 2016 polling miss much closer resembles the bottom two quadrants. In 2016, Clinton had leads of somewhere between the low to mid-single digits in the rust belt states: 6.5 in Wisconsin, 3.4 in Michigan, 1.9 in Pennsylvania (According to the RCP final average). Even then, Clinton was in much worse shape in many of those states at different times during the campaign, it just appeared to clear up for her in the final days of the race. What were the final leads in 2020? 4.7 in Pennsylvania, 7.9 in Michigan, 8.4 in Wisconsin (According to 538). When looking at 2016 polls and factoring in underweighting of non-college whites in the Midwest, it’s not hard to get to the final results. Try getting to the final 2020 results from those polls. It is impossible. In a similar manner to the image above, pollsters were actually very accurate in their prediction, they were just aiming at a completely wrong target, down and to the left of where the electorate actually was.
One of the reasons we were so confident that we could handle a 2016 type error was that, when encountering small polling misses in other countries, errors large enough for other models to make total seat counts closer in Canada and the UK, LeanTossup still had the right side favoured. The model was able to navigate through those small polling errors and get better seat totals than the rest of the field due to the strength of the demographic modelling, as in those elections, it pointed to increased electoral efficiency for the Liberals in Canada and the Tories in the UK, which you could not decipher from traditional swing methods. However, in the US, not only did we get a massive polling miss on the topline, but we also had some crosstabs that were horribly off, most notably among White college voters and minorities.
Does this mean that the model is more sensitive to large polling misses than other models? Given that this is our worst result for a National Model, this seems possible, and we will have to consider relying on a more rigid construct from state polling in the future. However, at the same time, if you would tell me (or really anybody familiar with the US political map) that Biden would lose Iowa and Ohio by 5+ points each, win Wisconsin and Pennsylvania by less than a point each, and lose Florida by 4, nobody would have guessed that Biden would win Georgia or Arizona, or even keep Texas within 10 points, which shows the strength of demographic modeling, to better estimate how the lean of each state will change year to year, rather than just relying on a rigid construct of state polling, which we just saw has a huge error.
At this point, given the projected Biden win of ~4-5%, I have no idea how you are supposed to get to there from basically any National, State, District or County poll. Looking at the National polls that were released on the final days of the campaign, only a small sample of polls (and not any Live Caller polls) showed anything near that number, and of all of the polls, they were clearly on the lower end of Biden’s lead, almost to the point of outliers. The only state poll that showed anything close to the national environment that materialized on election night was Ann Selzer’s final poll, which although was very accurate in Iowa, it was a clear outlier from all of their other polls from the entirety of the race. District polls were even worse. Take for example this tweet from frequent LeanTossup Podcast guest Noah Rudnick, highlighting district polling in the MI-03:
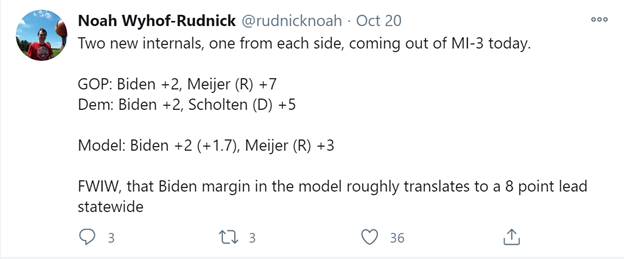
While we are still waiting for final results from that district, the general consensus on Twitter is that Trump won the district by ~3 points. The point here isn’t to debate exact margins (we’ll wait for complete results for that) but to show that neither party actually thought the election was as close as it actually was. Even thought the internals disagreed about which candidate was ahead in the congressional race, which is very common for internal polls, they both agreed that Biden was ahead in the Presidential race, by the exact same margin, which is extremely rare for partisan internal polls. Although this is much too small of a sample size to say that there was some sort of shy Trump effect, this is very clear evidence of a systematic polling miss, across all pollsters using completely different methods.
While some people might suggest it was the result of a late swing towards Trump, I personally don’t believe that theory. In a race in which polling averages barely moved, and no single event (outside of the conventions, of which even the post-convention bounces were much lower than usual) seemed to move the vote intention dial, I prefer the Occam’s Razor Theory (the simplest possible explanation). Since the polling average never moved no matter what news stories were happening, the simplest explanation is that the polling average never actually moved, it was always this close, and that polls were just systematically biased towards Biden by 5-6 points the entire time. Obviously, there is no proof to this theory (or any other theory of how the race progressed, due to the large polling miss) and while there will likely be research as to why the polling never moved, if the simplest theory is correct, then although Selzer deserves credit for her final poll being truly amazing, and for releasing what was a very clear outlier poll without any hesitation, questions remain why she was so much higher on Democrats in all of her other polls of the race except for her last one. Many people questioned her final poll, especially at the congressional level, especially since it was such a large outlier. If all of her other polls had shown a similar result to her final poll, then it’s very possible people would have had increased confidence in her polling, instead of treating it like a random sampling error (which, of a single poll, can be quite likely).
The polling error was even more compounded by the polls the model favoures, live caller polls. From our experiences in other countries (Canada, UK) the best pollsters use Live Caller as the method to contact voters. While favouring Live Caller polls has worked well in the past with US elections (Governors races from 2019, US Democratic Primary in 2020) they were hands down the worst this year. Additionally, some online pollsters (which the model puts less of a weight on) were among the most Trump friendly, which lead to our model showing Biden with a larger lead than some of the other models, but one that lined up perfectly with the environment that the Live Caller pollsters were showing. Even though Selzer is a live caller pollster and does get heavy weight, when adding the final polls, when all of the other live caller polls show a large Biden lead (in multiple states, and nationally) and one Selzer poll is showing something completely different than all of the other polls they have released this cycle in what might be the most static polling environment ever, you cannot model off of just that one Selzer poll, even if you think it might be right, you have to go with what the preponderance of evidence is saying the lead is at, which extrapolated to a Biden lead in Iowa.
This brings up the question of obviously biased pollsters (Rasmussen, Trafalgar, others) and internal polls. We tend to ignore internal polls, unless there is no other polling in the race. This is a good time to note that internal polls, from both sides, massively overrated the Democrats, which is extremely weird. Typically, you would expect GOP internal polls to show better results for Republicans than the actual results, but they barely showed marginally better results for the GOP than public polls, and were systematically biased towards the Democrats, as the GOP was expecting double digit seat losses in the House, were reconciling with losing the Senate, while spending money and sending surrogates to Texas to protect the state house and defend the state for the President and the Senate seat.
Should we have thrown obviously Pro-Trump leaning online pollsters like Rasmussen and Trafalgar into the model? We didn’t, but apparently the correct answer was yes, if only to get marginally closer to what the final national environment would look like. The issue with including polls that are intentionally biased towards Trump and the GOP, is that you are functionally saying “Well, we think the polls will underestimate Trump’s support like in 2016, so we’re going to throw in polls that are obviously biased towards Trump, in order to lower our average Biden lead”.
Personally, I have a huge issue with this. Many people thought the 2019 UK Election would be better for Labour than projected, because they did better than their polling suggested in the 2017 election. However, as we now know, this was not the case, as demographics and an unpopular leader cost them support across the country. At the time we were the only website saying this with conviction, as many people were concerned we could see a replay of 2017 on election night. In the US, we trusted that polls had corrected their mistakes after 2016, which good polling from the 2018 Midterms and governor races lead us to believe that they had, in a similar way that other pollsters in the UK had corrected after Brexit and 2017. It is now painfully apparent they haven’t, or that somehow, whenever Donald Trump is on the ballot, crazy polling misses happen in his direction (except not really in the 2016 primaries, but whatever).
Basically, if polls in the US are going to be this wrong, what are we supposed to predict elections with? Lawn signs? I’m seriously asking. If the only thing we can count on the polling for is to be is wrong, how can you even predict elections in the US at all? Economic factors were a mess because of the pandemic, so depending on which set of them you look at (pre or post-pandemic) they either point to a Trump popular vote win (pre-pandemic) or a Biden landslide (post-pandemic). Obviously neither of those happened. Do you use incumbency? Trump with a double-digit net unfavourability is not particularly encouraging for him keeping the popular vote as close at it will likely end up. Additionally, due to the large miss of the polls this year, all favorability numbers from earlier polls should be questioned, as there is no reason to think they are more accurate than the election polls, and not subject to the same systematic error that occurred.
So can we point to any positive signs for the model? Actually yes, we can. Let’s look at the swing(ish) state of Virginia. Specifically, the toplines predicted from each of the other models:
| Model | Biden Vote | Trump Vote | Margin |
| Actual | 54.3 | 44.2 | Biden+10.1 |
| LeanTossup | 56.3 | 40.5 | Biden+15.8 |
| 538 | 55.8 | 43.3 | Biden+12.5 |
| JHK | 54.6 | 42.8 | Biden+11.8 |
| Economist* | 55.9 | 44.1 | Biden+11.8 |
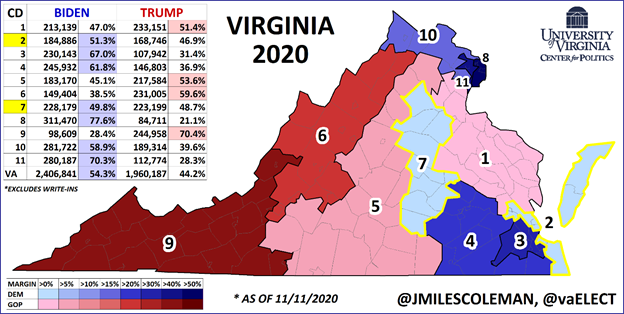
So, right off the top, when just looking at the topline numbers (which is the most important thing), clearly the LeanTossup model was the worst. However, one of the benefits of the LeanTossup model is that it produces many more datapoints that the other models. The LeanTossup model also makes projections for Presidential Results by Congressional District and by County. Why am I using the example of Virginia for this article? At this point, it is one of the few states we have results by Congressional Districts for. J Miles Coleman calculated these results, and posted them on twitter, which allows us to compare these results to what the LeanTossup model was projecting in each district. Was the LeanTossup model just a miss across the board? Was it a systematic error like the polling, or was it more focused in certain areas/districts? Here is the map of Virginia Congressional Districts, credit of course to J Miles Coleman.
How did the LeanTossup Model do? Here is the comparison in chart form:
| District | Biden Actual | Biden LeanTossup | Trump Actual | Trump LeanTossup |
| VA-01 | 47.0 | 46.1 | 51.4 | 50.8 |
| VA-02 | 51.3 | 52.2 | 46.9 | 44.6 |
| VA-03 | 67.0 | 75.1 | 31.4 | 21.7 |
| VA-04 | 61.8 | 68.3 | 36.9 | 28.5 |
| VA-05 | 45.1 | 46.0 | 53.6 | 50.9 |
| VA-06 | 38.5 | 37.2 | 59.6 | 59.7 |
| VA-07 | 49.8 | 50.4 | 48.7 | 46.4 |
| VA-08 | 77.6 | 84.2 | 21.1 | 12.5 |
| VA-09 | 28.4 | 26.9 | 70.4 | 70.0 |
| VA-10 | 58.9 | 58.7 | 39.6 | 38.1 |
| VA-11 | 70.3 | 76.5 | 28.3 | 20.2 |
So, overall, the Presidential by Congressional Model did pretty well in Virginia, with one glaring mistake: overestimating Biden in some heavily leaning Democratic districts (VA-03, VA-04, VA-08, VA-11). What do all of those districts have in common? The VA-03 and the VA-04 are downstate districts that have a large Black population, and the VA-08 and the VA-11 are heavily white college districts in the DC-suburbs. This is completely consistent with the polling error I described above: pollsters overestimating Democrats with White college voters, and with minorities. In the model, these districts (and counties) are linked to the statewide numbers, meaning they fit together.
Unlike other models, the LeanTossup model doesn’t just say “We think Biden will win Virginia by 15.8%”, it says “We think Biden will massively overperform Clinton in districts with large populations of white college and minority voters, to win the state by 15.8%”. Many people will point at the model and say “LeanTossup had the worst US model in 2020”, and they are mostly correct, but they are ignoring that under the surface, many things that the model projected actually happened, and despite the large polling miss the model didn’t significantly underestimate Trump in many parts of the country.
So, what’s the final conclusion? The LeanTossup model had a bad night. Through a series of large scale, systematic polling errors, which were compounded by our model methodology, we ended up on the wrong side of a large polling error. However, at the same time the model was able to correctly estimate Trump’s strengths in many parts of the country, but overestimated Biden in the areas that were the best for the Democrats. While other models didn’t have to worry about large scale demographic misses, the LeanTossup model was especially vulnerable to them, and for that reason missed heavily in the Democrats favour. We are not done in the US, and as we continue to sift through the results from the US, we will continue to make improvements to the model, to correct and fix the mistakes that lead to the miss from 2020. However, despite this result, we are not going to abandon demographic modeling. We firmly believe this is the best way to build a model, and if given a choice, would not build it any other way. While it needs some adjustments, based off of the 2020 results, we believe it is the best way, going forward, to have the fewest errors in the long term in terms of electoral projections.