
With the first week of the CDL in the books, it’s time to launch the LeanTossup CDL model! While created and tested last year, but never publicly released, it was valuable to determine game by game winners, and to determine which team was stronger in which game modes.
How does the model work?
The model works similar to standard ELO models. In an ELO model, all teams have an ELO rating, and that rating goes up or down depending on team performance. However, while most ELO ratings are usually of one whole team, Call of Duty is different. In Call of Duty, each series is a best of 5, in which games 1 and 4 (if necessary) are Hardpoints, games 2 and 5 (if necessary) are Search and Destroy and game 3 is always a different game mode as well (in Call of Duty Cold War, Control is currently the map type used for game 3). Each of those game modes play differently, and require different strategies to win (In Hardpoint players constantly respawn, while in Search and Destroy a player only has one life a round). In this way, the LeanTossup CDL model treats each mode (and each game number) differently, and has team ELO ratings for each game mode (and each map). For example, in our first ratings (seen below) the model believes that Optic is the 3rd best Hardpoint team (2nd best at Map 1, 8th best at Map 4), while Optic is the 10th best Search and Destroy team (8th at Map 2, 11th at Map 5).
How does it determine how much a teams rating is increased/decreased?
One of the differences between this model and most standard ELO models is it uses margin of victory to determine how much a team’s rating would increase or decrease. Most ELO models simply use wins/loses. Did a better team win? Then it’s rating won’t increase very much. If an upset occurs, then both team’s rating will change significantly. For the LeanTossup model, margin of victory is considered. Did the model predict Team A to beat Team B at Hardpoint 250-200 but then squeak out a 250-249 win? In that case, the ELO rating of Team A would actually go down, as opposed to the ELO rating increase that most models would give to the winning team. This is also an important feature, as many teams improve in mods over time as they dedicate time to practicing in them. An ELO model allows for gradual improvement of a team’s ELO ratings in each mode as the season progresses. For example, right now Optic is struggling with Search and Destroy. Because of their struggles, they might choose to practice Search and Destroy more than the other game modes, and suddenly they start losing Hardpoints. A model like the LeanTossup ELO model, allows for improvement/decay (adjusted for expectations) in all game modes to be evaluated and quantified.
How accurate are the rankings right now, given it is early in the season?
The LeanTossup model starts all teams out at 1000 ELO rating in all games modes at the start of the season. As more games are played, ELO ratings increase or decrease according to performance. Since this is the start of the season, the model is using data from Week Zero (the fan voted exhibition matches) and all of the matches from Week 1. At this point, all of those results are weighted equally, however, once more data becomes available, the Week Zero results will be reduced in weight (hopefully after this week, or maybe after Week 3 of the season. Here are the rankings for each team by mode and map as of now:
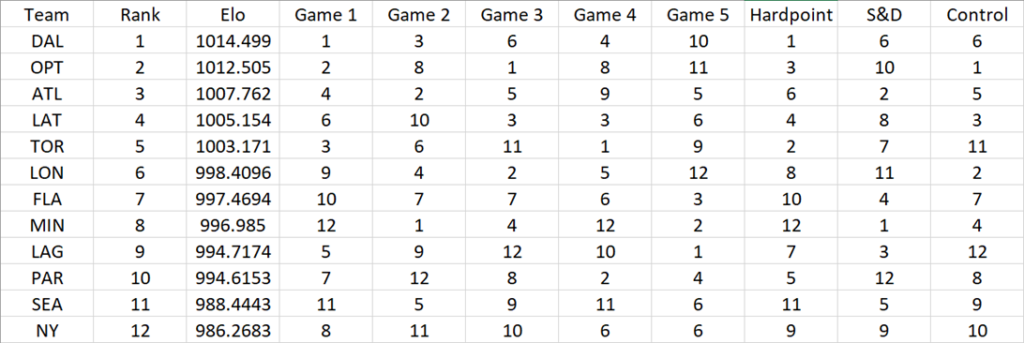
At this point, we don’t have enough data for many of these teams to get an accurate read on them. London, Florida, Toronto and New York have only played 2 games each, including Week 0. London is likely too high, as both of their were close loses in Game 5, meaning they are 4-6 in Map win counts, leading to an artificially inflated ELO rating. Florida is likely too low, as their win against Atlanta came when Atlanta still had the same neutral rating (1000) as all other teams at the start of the season, and their loss to Toronto hurts them more, as their status as a relatively strong team had not been established by their second game. Interestingly, Dallas and Optic are still 1-2, even though both went 1-1 last weekend, and especially odd since the team Optic lost to (Atlanta) is sitting 5 ELO points behind them. The reason is that their dominant 3-0 wins (Dallas against New York and Seattle, Optic against LA Thieves and Paris) increased their ELO much more than Atlanta’s 3-0 win against the LA Guerillas. Although that appears to be a flaw in the system, after a few more weeks it will start to balance out, and the projections should be very powerful for the Stage 1 Playoffs.
Weekend Matches:
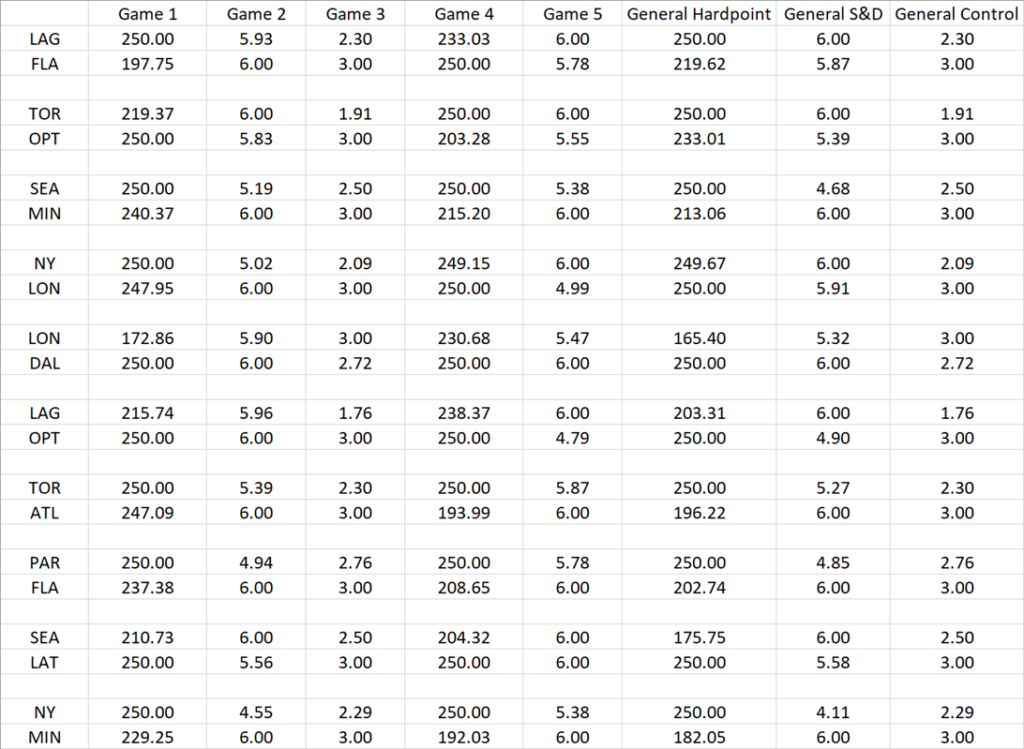
For Thursday, the model believes both matches are competitive, and favours a slight Toronto upset over Chicago due to Optic’s weakness in Search and Destroy. On Friday it sees Seattle taking Minnesota to a Game 5 in a competitive series, and New York winning it’s first map in the Hardpoint against London in what can also be a competitive series, due to New York’s improvements since Week Zero. On Saturday, the model thinks that London shouldn’t give Dallas much trouble, Optic should put LAG away pretty quickly, and Toronto/Atlanta could be a very close series going to a Game 5. On Sunday, Paris and Florida look to be in a competitive match, with Florida winning both Search and Destroys to take the series 3-4, LA Thieves beating Seattle in 4, and New York and Minnesota going to Game 5 to determine the winner.
As the season progresses, look for by-weekly updates, as I will have an article on Monday morning recapping the weekend, and then on Wednesday looking ahead to all of next week’s matches.